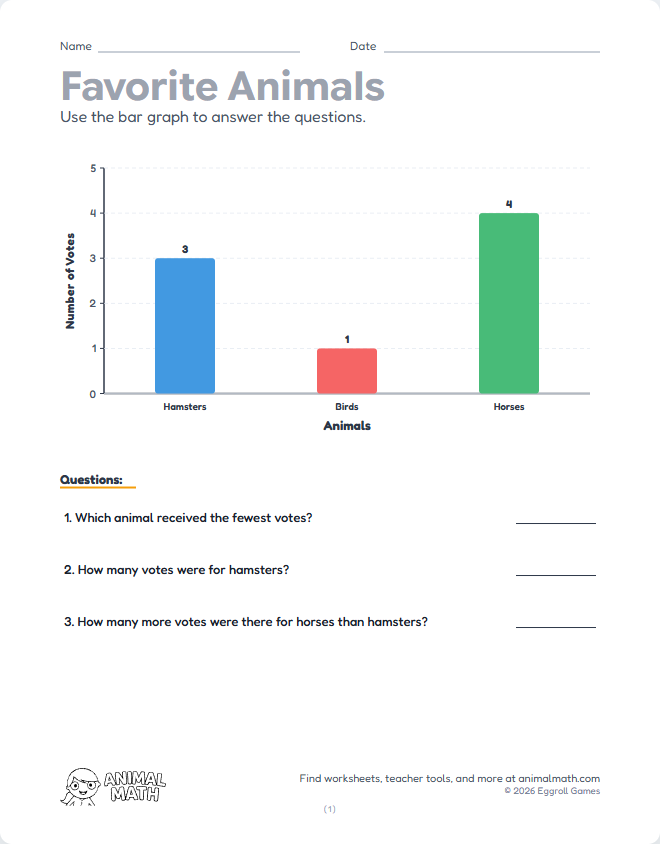
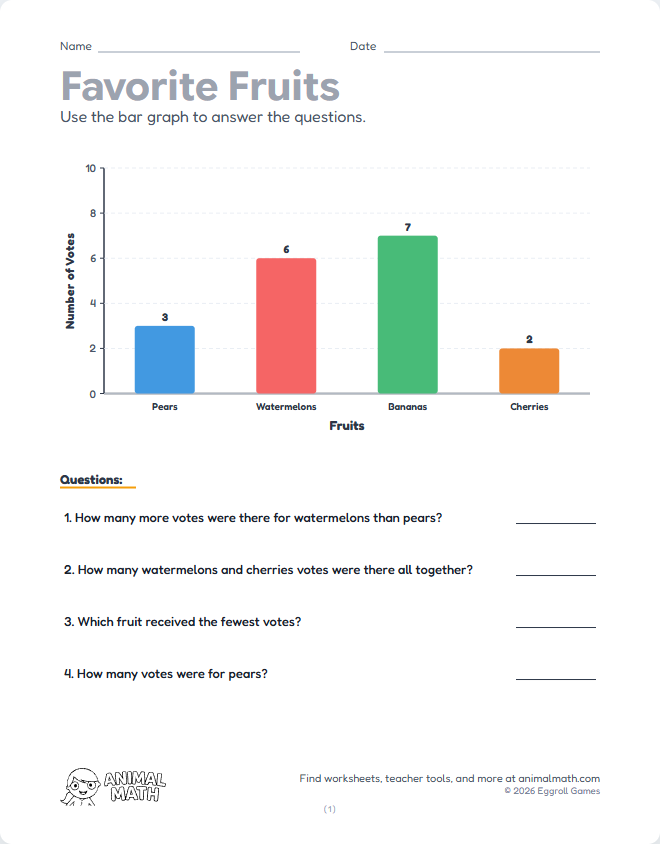
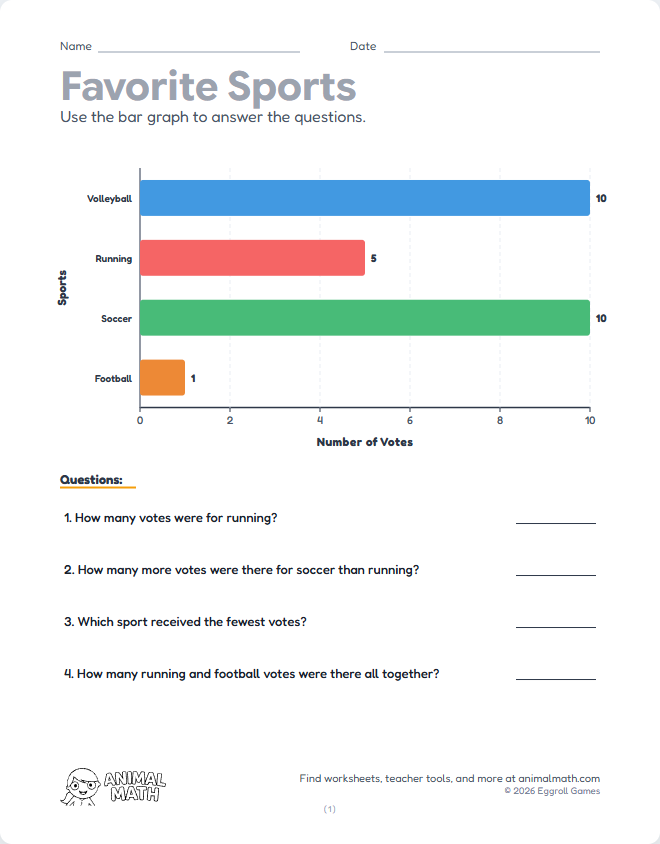
Interpret bar graph data with values up to 15. Five categories and 5 comprehension questions challenge growing data skills.
This worksheet supports the following Common Core State Standards for Mathematics:
Interpret bar graph data with values up to 15. Five categories and 5 comprehension questions challenge growing data skills.