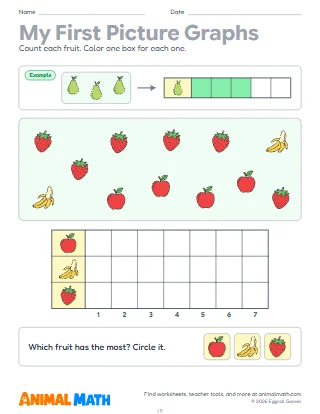
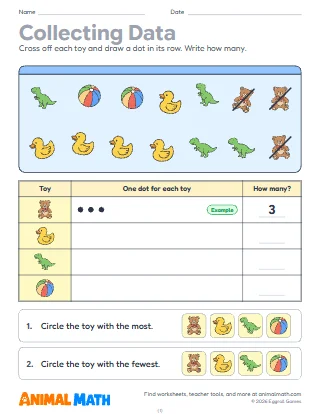
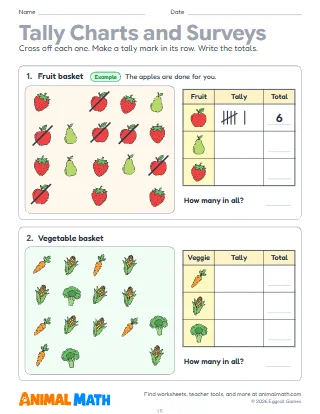
Five pages of picture graphs with three kinds in each graph, where every picture stands for 1. On page 1 students read a graph of fruit that goes across and write how many apples, pears and oranges there are (the apples are done as an example), then read a graph of pond animals that goes up, write how many of each, and circle the kind with the most or the fewest. Page 2 has two graphs, party treats and balls in the gym, with three questions under each: how many more, how many fewer and how many in all; the first is worked out as an example. On page 3 students count the tally marks for three zoo animals, write the numbers, and make a picture graph by drawing one circle in a box for each animal, then answer two questions. Page 4 is a garden picture: students count the carrots, tomatoes and peppers, color one box for each in a graph (the carrots are colored as an example), and answer three questions. Page 5 shows a tally chart and three picture graphs, and students circle the one that matches; then they read a graph of a class vote and circle true or false for each sentence.
Build a real graph first: give each child a sticky note to put in the row for a favorite fruit, and read it together. Which row is longest? How many more chose apples than pears? How many voted in all? Show how lining up the rows from the same starting place makes it easy to compare. On page 5, ask students to explain how they knew the other two graphs did not match.
Sort a handful of snacks, toys or socks into three kinds and line each kind up in a row to make a real picture graph. Ask: which kind has the most? How many more? How many in all? Then draw it on paper, one picture for each thing.
This pack supports the following Common Core State Standards for Mathematics:
© Copyright 2010. National Governors Association Center for Best Practices and Council of Chief State School Officers. All rights reserved.
A 5-page picture graph pack for 1st grade, with three kinds in every graph and each picture standing for 1. Read a graph of fruit that goes across and a graph of pond animals that goes up, write how many of each, and circle the most and the fewest. Answer how many more, how many fewer and how many in all from graphs of party treats and gym balls. Make a picture graph from a tally chart by drawing a circle for each zoo animal, and make one from a garden picture by counting the vegetables and coloring a box for each. Then circle the graph that matches a tally chart and decide whether sentences about a class vote are true or false. Every page comes in color and in black and white. Answer keys included.
Tell us what to make next, or build your own with a worksheet maker.
This worksheet is free to download, print, copy, and hand out in your classroom or at home. You do not need to create an account, and there are no watermarks on the PDF.