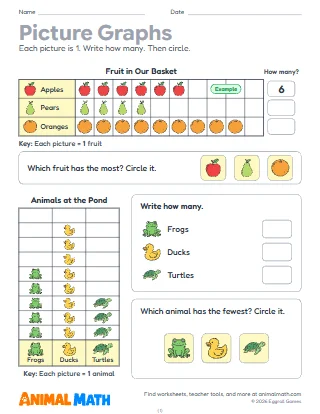
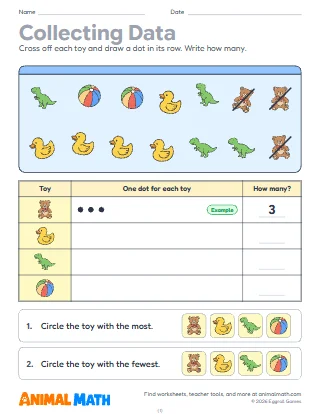
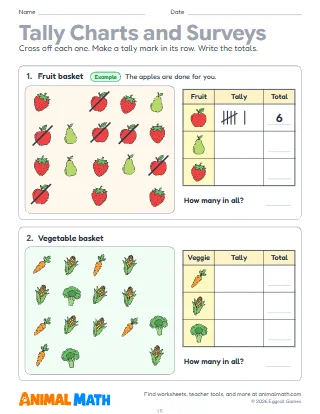
Seven pages for one unit on data and graphs. Page 1 is a pre-check to give before the unit, to see what students already know. Pages 2 and 3 are a review to do together before the test, with a tip on every question. Pages 4 and 5 are the unit test, Form A. Pages 6 and 7 are Form B: the same questions in the same order with different numbers and pictures, for a retake, a make-up or a second seating. Each form has 10 questions, one point each, and a Score line on its first page.
Give the pre-check on the first day of the unit and sort the class by what they missed. Do the review the day before the test, reading the tips aloud. Question 10 (sorting with a Venn diagram) is taught in 1st grade in Oklahoma: leave it out and score out of 9 if your class does not learn it. The answer keys name each question's skill, so a missed question points to the lesson to reteach.
Use the review as practice before a test at school, or Form B as a check after the unit. Read each question aloud with your child, and ask them to point to the part of the graph that gives each answer.
This pack supports the following Common Core State Standards for Mathematics:
© Copyright 2010. National Governors Association Center for Best Practices and Council of Chief State School Officers. All rights reserved.
A unit test for data and graphs in 1st grade: a one-page pre-check, a two-page review with a tip on every question, and the unit test in two forms (A and B) that ask the same questions with different numbers and pictures. Students sort and count pictures into three groups, read and draw tally marks, tally the answers to a class survey, read picture graphs and bar graphs, make a bar graph from a tally chart, and find how many more, how many fewer and how many in all. The last question (sorting with a Venn diagram) is for Oklahoma, where 1st grade learns it. Answer keys name the skill and standard of every question.
Tell us what to make next, or build your own with a worksheet maker.
This worksheet is free to download, print, copy, and hand out in your classroom or at home. You do not need to create an account, and there are no watermarks on the PDF.