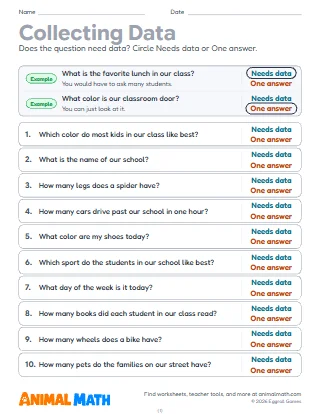
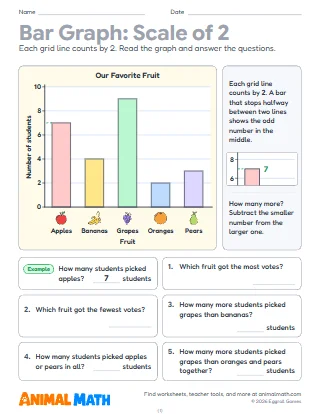
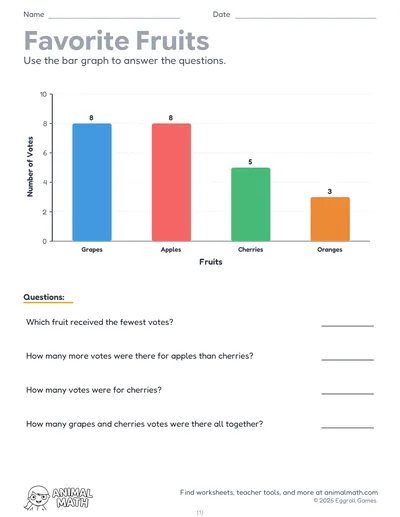
Five pages on making bar graphs, each with a worked example. Page 1 turns a tally chart of a class vote into a bar graph that goes up: write each tally as a number, then color a bar up to it. On page 2 students count four kinds of fruit in a picture, write how many and draw the bars. Page 3 gives a table of books read, and students draw a bar graph that goes across and write its title and both axis labels. Page 4 counts by 2s: bars for odd numbers stop halfway between two lines. Page 5 starts with a list of survey answers: tally them, draw the graph, then answer put together, take apart and compare questions.
Take a class vote with four choices and make the bar graph together on chart paper, one square for each vote. Point to the title and the two labels and ask what each one tells a reader. Then ask questions that join, take apart and compare: how many voted for fall or summer, how many did not vote for winter, how many more voted for summer than spring?
Sort a handful of things, like crayons by color or socks by kind, and draw a bar graph together on grid paper. Give it a title and labels, then take turns asking how many more and how many in all.
This pack supports the following Common Core State Standards for Mathematics:
© Copyright 2010. National Governors Association Center for Best Practices and Council of Chief State School Officers. All rights reserved.
A 5-page 2nd grade pack on making bar graphs. Turn a tally chart into a bar graph that goes up, count the fruit in a picture and graph it, draw a bar graph that goes across from a table and write its title and both axis labels, draw bars on a graph that counts by 2s, and make a graph from a class survey. Then answer put together, take apart and compare questions from each graph: how many in all, how many more, how many fewer and how many are not one kind. Every page comes in color and in black and white. Answer keys included.
Tell us what to make next, or build your own with a worksheet maker.
This worksheet is free to download, print, copy, and hand out in your classroom or at home. You do not need to create an account, and there are no watermarks on the PDF.