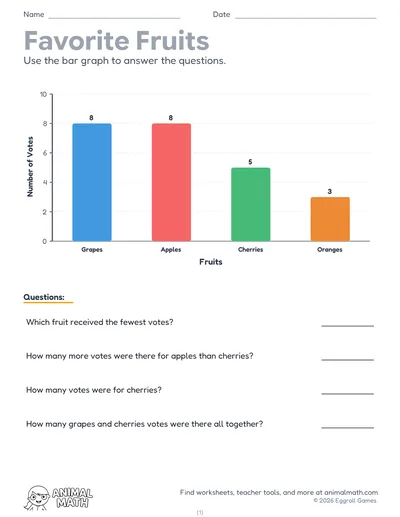
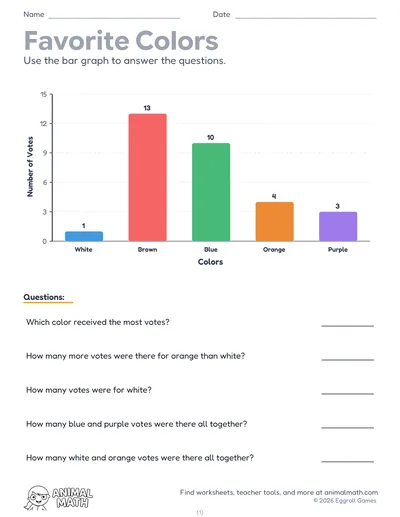
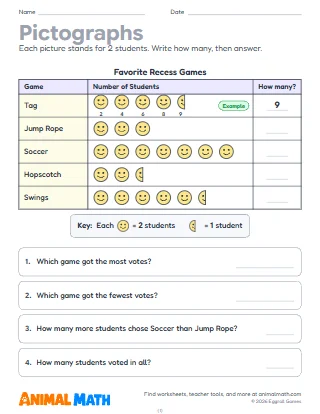
Five pages on bar graphs whose grid lines count by more than 1. Page 1 reads a class vote for a favorite fruit on a graph that counts by 2: a picture shows that a bar ending halfway between 6 and 8 means 7, and students find how many, the most and the fewest, how many more, how many in all, and a two-step question. Page 2 reads a bar graph that goes across and counts by 5, about the balls in a gym. On page 3 students draw the bars for a table of vegetables picked on a graph that counts by 10, with the first bar drawn as an example, then answer questions from their own graph. Page 4 counts by 100: cans recycled by each grade, with questions that add and subtract within 1,000. Page 5 asks which scale, 1, 2, 5 or 10, fits a set of data best, then students pick the scale for a graph of shells found at the beach, write its numbers in the boxes, draw the bars and answer two two-step questions.
Take a class vote, like a favorite fruit or a favorite sport, and graph it on the board twice: once counting by 1s and once by 2s. Ask what each grid line is worth, and where a bar for 7 has to stop. Before page 5, give small groups a data set and a graph with a fixed number of lines, and let them try each scale to see which one fits.
Count something together over a week, like books read or steps up the stairs, and make a bar graph that counts by 2s or 5s. Ask your child to read the scale before reading a bar, and to tell you how many more one bar shows than another.
This pack supports the following Common Core State Standards for Mathematics:
© Copyright 2010. National Governors Association Center for Best Practices and Council of Chief State School Officers. All rights reserved.
A 5-page scaled bar graph pack for 2nd and 3rd grade. Read a bar graph whose grid lines count by 2, where some bars end halfway between two lines, a bar graph that goes across and counts by 5, and one that counts by 100, and answer how many, the most and the fewest, how many more or fewer, how many in all, and two-step questions. Draw the bars of a graph scaled by 10 from a table. Then choose the scale that fits a set of data best, write the numbers on a graph's scale and draw its bars. Every page comes in color and in black and white. Answer keys included.
Tell us what to make next, or build your own with a worksheet maker.
This worksheet is free to download, print, copy, and hand out in your classroom or at home. You do not need to create an account, and there are no watermarks on the PDF.