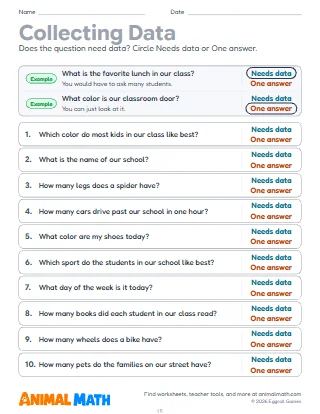
Five pages on line graphs and the data behind them. Page 1 reads a line graph of a puppy's weight and one of ice cream cones sold each month: a value on the graph, the least or greatest, how much it changed, when it stayed the same, when it fell the most, and a prediction. Page 2 shows how each row of a table becomes a point on a line graph, then has students make one: write the title and the axis labels, number the scale by 5s, plot the points and join them. Page 3 reads a graph of a hike whose scale counts by halves of a mile and a graph of a pond's depth whose scale counts by 0.5 feet: when the hikers rested, how far they went, when the pond dropped the most, and what comes next. Page 4 compares the books two classes read on a double bar graph, then finishes a double bar graph of rain in two towns from a table, with the first month drawn as an example. Page 5 sorts questions into ones that need data and ones that do not, chooses a poll, an observation, a measurement or an experiment to collect data, plans a question of the student's own with 30 data points or fewer, and plots hours of practice and free throws made on a scatterplot.
Record the temperature outside at the same few times each day for a week, or the height of a classroom plant each Monday, and graph it together as a line graph. Before page 3, ask what each grid line is worth when the numbers on the scale skip some lines. On page 5, let pairs carry out the plan they write and make a graph of what they find.
Look for line graphs in the weather report or on a fitness tracker and ask your child what the graph shows, when it went up or down, and what might come next. Keep a simple record together, like minutes of reading each day, and turn it into a line graph at the end of the week.
This pack supports the following Common Core State Standards for Mathematics:
© Copyright 2010. National Governors Association Center for Best Practices and Council of Chief State School Officers. All rights reserved.
A 5-page line graph pack for 4th and 5th grade. Read line graphs of a growing puppy and of ice cream sales: find values, the greatest and least, when the data rose, fell or stayed the same and by how much, and make a prediction. Make line graphs from tables with a title, labeled axes and a scale in whole-number steps. Read line graphs with a fraction scale and a decimal scale, compare two classes on a double bar graph and finish a double bar graph from a table. Then decide which questions need data and how to collect it, plan a data question of your own, and plot paired data on a scatterplot. Every page comes in color and in black and white. Answer keys included.
Tell us what to make next, or build your own with a worksheet maker.
This worksheet is free to download, print, copy, and hand out in your classroom or at home. You do not need to create an account, and there are no watermarks on the PDF.