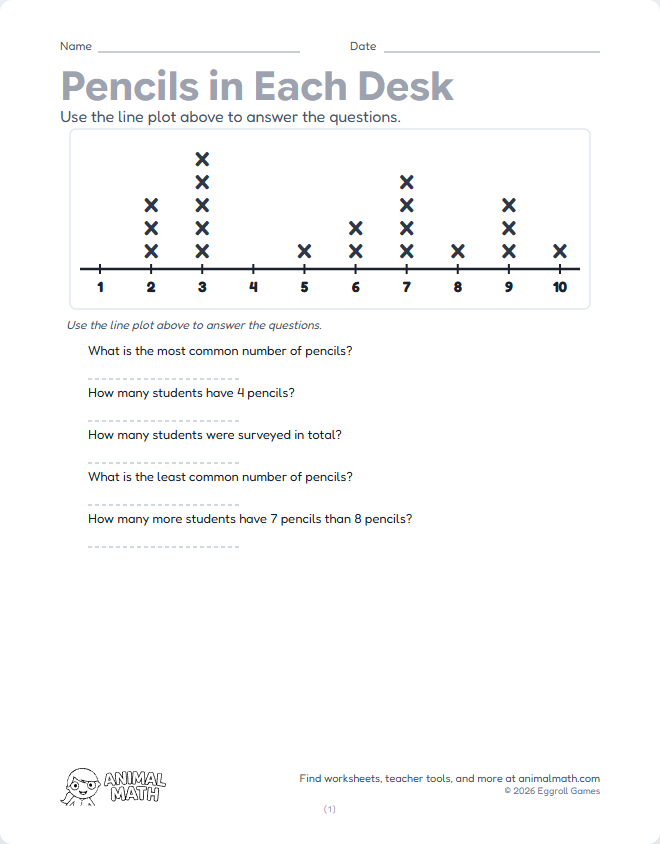
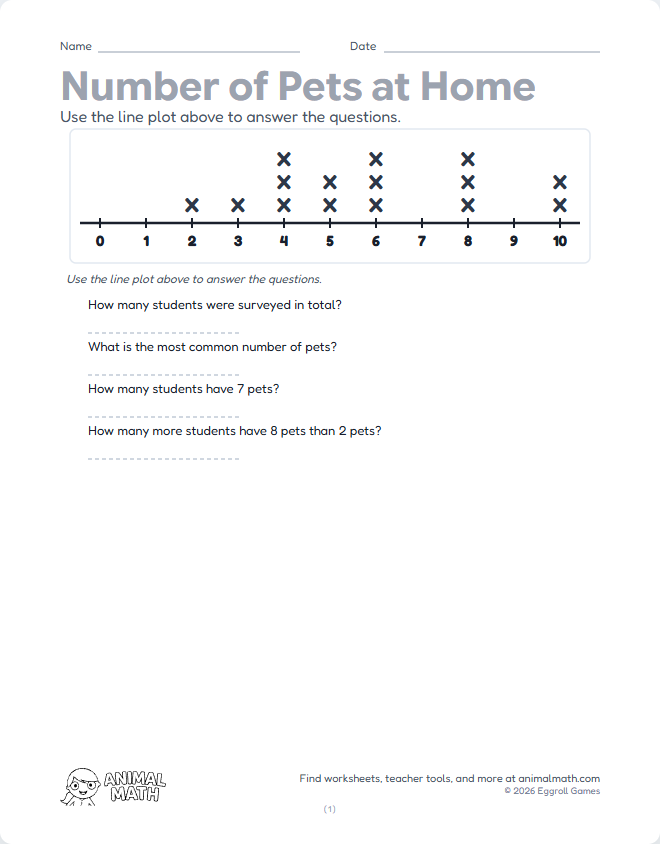
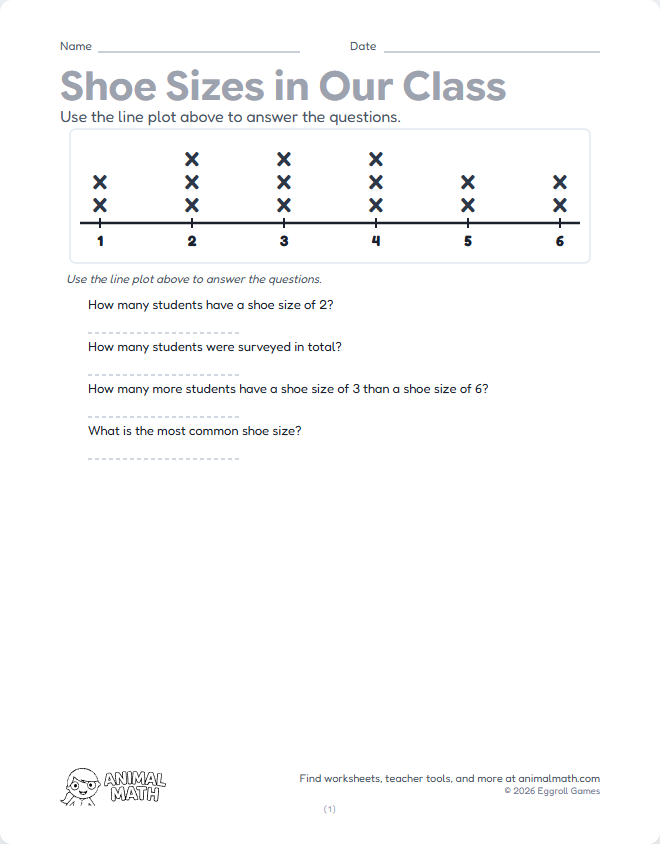
Read a line plot showing books read and answer questions. Simple number line from 0 to 5.
This worksheet supports the following Common Core State Standards for Mathematics:
Read a line plot showing books read and answer questions. Simple number line from 0 to 5.