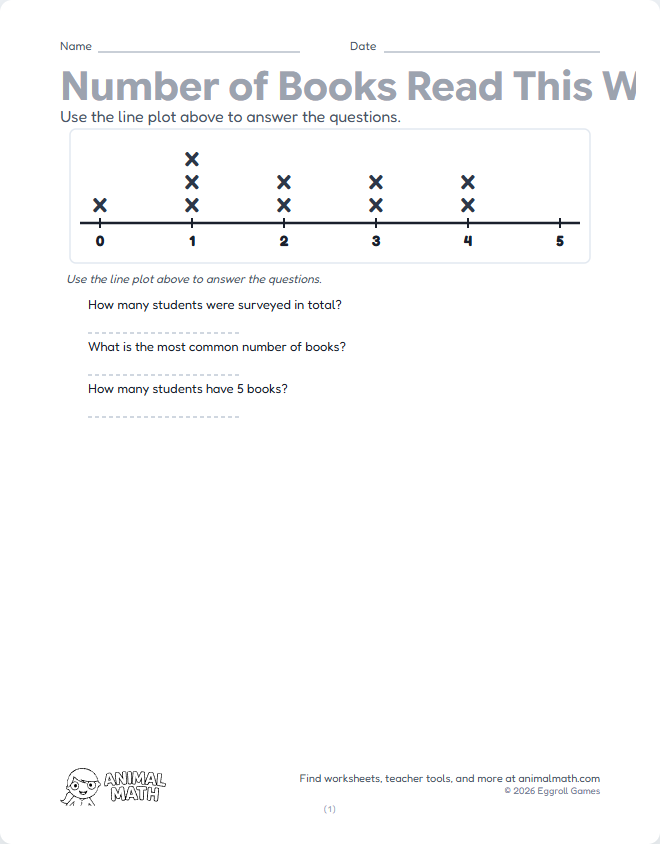
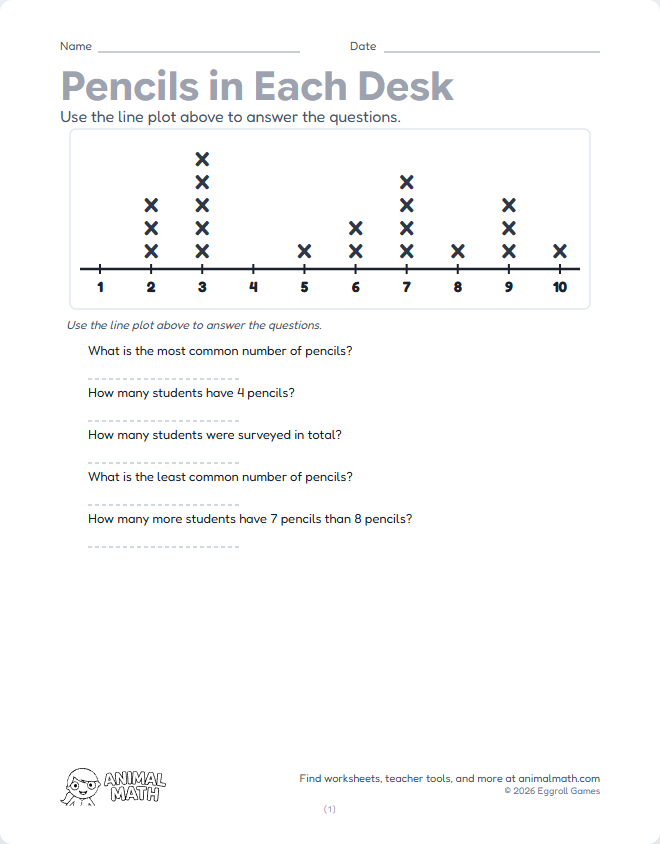
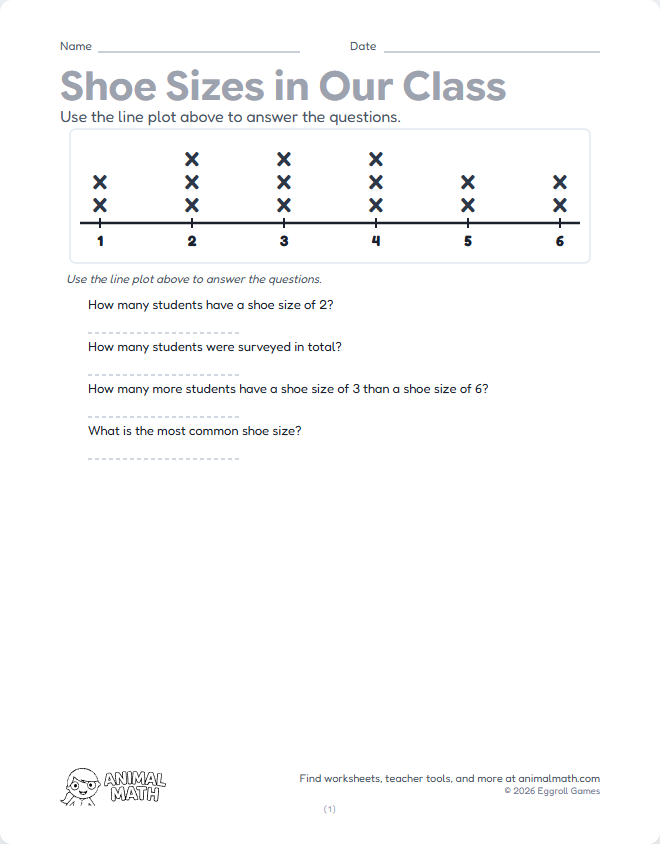
Interpret a line plot about pets with values from 0 to 10. Practice finding most, least, and totals.
This worksheet supports the following Common Core State Standards for Mathematics:
Interpret a line plot about pets with values from 0 to 10. Practice finding most, least, and totals.