Eight exit tickets, one for each lesson of a unit on data and graphs, in lesson order. Each page holds one lesson's ticket four times: copy the page, cut on the dashed lines, and seven copies give a class of 28 a ticket each. A ticket takes a few minutes at the end of the lesson. Students answer two or three questions about a small chart or graph, then circle a face beside the lesson's "I can" line to show how sure they feel.
Hand out the tickets in the last five minutes of the lesson and collect them at the door. Sort them into three piles (got it, almost, not yet) to plan tomorrow's small groups. The faces show how students feel about the lesson, the answers show what they can do; the two do not always agree. Ticket 3.8 (sorting with a Venn diagram) is for Oklahoma, where 1st grade learns it. The unit test is a separate pack.
Use a ticket as a quick check after practicing a skill together. Read the questions aloud, and ask your child to point to the part of the chart or graph that gives each answer.
This pack supports the following Common Core State Standards for Mathematics:
© Copyright 2010. National Governors Association Center for Best Practices and Council of Chief State School Officers. All rights reserved.
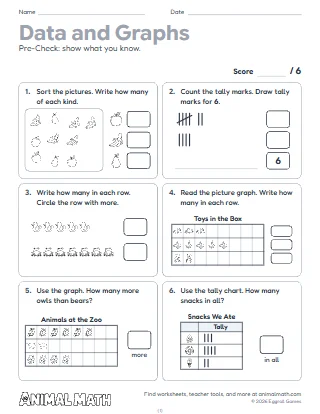
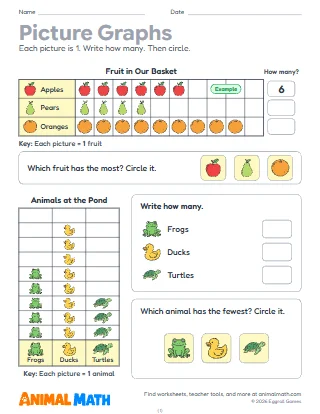
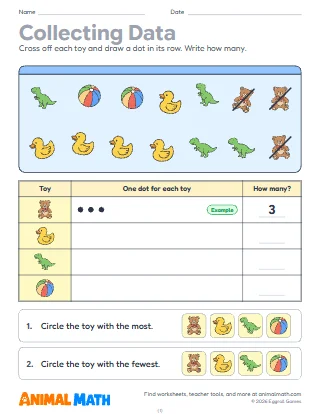
Exit tickets for every lesson of a 1st grade unit on data and graphs: one page a lesson, with the same ticket four times to copy and cut apart. Each ticket has two or three quick questions and ends with an "I can" line and three faces for students to rate themselves. Students sort and count pictures into three groups, read and draw tally marks, tally the answers to a class survey, read picture graphs and bar graphs, make a bar graph from a tally chart, and find how many more, how many fewer and how many in all. The last ticket (sorting with a Venn diagram) is for Oklahoma, where 1st grade learns it. Answer keys for every ticket.
Tell us what to make next, or build your own with a worksheet maker.
This worksheet is free to download, print, copy, and hand out in your classroom or at home. You do not need to create an account, and there are no watermarks on the PDF.