Loading preview...

Features

  • Forms A and B ask the same questions with different data
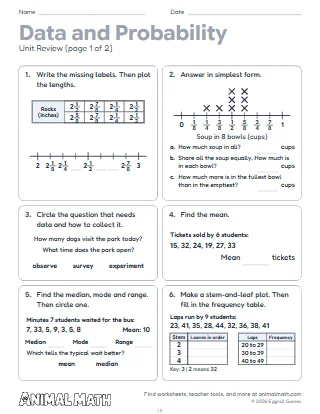
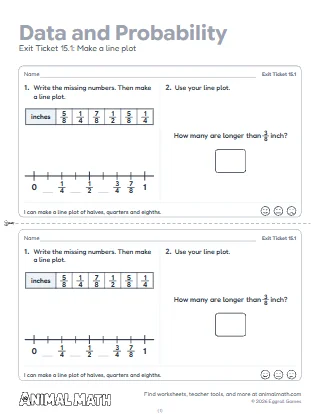
  • Write the missing labels on a line plot in eighths and plot the lengths, then find the total, the equal share and the most minus the least
  • Pick the question that needs data and how to collect it
  • Find the mean, the median, mode and range, and which measure a far value changes most
  • Make a stem-and-leaf plot, a frequency table and a scatterplot, and read a line graph, a double bar graph, a histogram and a circle graph
  • Write probabilities from 0 to 1 as fractions, list the outcomes in a tree diagram and count outcomes by multiplying
  • The Common Core questions come first; the twelve after them are for the states that teach them in 5th grade
  • Answer keys name the lesson and skill of every question

Skills Covered

  • Make a line plot of lengths in halves, quarters and eighths
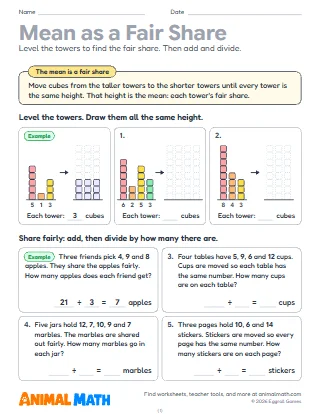
  • Solve problems with a line plot, sharing a total equally
  • Pick a question that needs data and how to collect it
  • Find the mean
  • Find the median, mode and range
  • Make a stem-and-leaf plot and a frequency table
  • Read a line graph with a decimal scale
  • Read a double bar graph
  • Make a scatterplot and tell its trend
  • Read a histogram and a circle graph
  • Write a probability from 0 to 1
  • List and count outcomes

How to Use This Pack

The unit test for the 5th grade unit on data, line plots and probability. Pages 1 and 2 are Form A. Pages 3 and 4 are Form B: the same questions in the same order with different data, for a retake, a make-up or a second seating. Each form has 14 questions and a Score line on its first page. Questions 1 and 2 are the Common Core line plot lessons; questions 3 to 14 (collecting data, the mean, the median, mode and range, stem-and-leaf plots and frequency tables, line and double bar graphs, scatterplots, histograms and circle graphs, probability and sample spaces) are for the states that teach them in 5th grade. No question asks a problem from the unit's exit tickets or the practice sheets. The pre-check and the unit review are packs of their own.

In the Classroom

Give Form A the day after the unit review. A class that follows the Common Core can stop after question 2 and score out of 2. In other states, give the questions for the lessons your class was taught and score out of that number. Most questions have more than one part (the labels and the plot, three answers from one line plot, a question and how to collect its data, a stem-and-leaf plot and its frequency table, three probabilities, every outcome of a tree): give the point when every part is right, or a share of the point for each part if you prefer. The answer keys name each question's lesson and skill, so a missed question points to the lesson to reteach.

At Home

Use Form B as a check after the unit. Pour water into a few cups, measure each to the nearest eighth of a cup, make a line plot, and work out how much each cup would hold if the water were shared equally.

Tips for Success

  • Write halves and quarters as eighths before plotting them
  • The mean is the fair share: add the data, then divide by how many
  • Put the data in order before finding the median
  • Look at what each grid line counts by before reading a graph
  • Use Form B as a retake after reteaching what was missed

Common Core Standards Alignment

This pack supports the following Common Core State Standards for Mathematics:

  • 5.NF.A.1 Add and subtract fractions and mixed numbers with unlike denominators by rewriting them as equivalent fractions with a common denominator.
  • 5.NF.A.2 Solve story problems that add or subtract fractions of one whole, unlike denominators included, and check that answers make sense with benchmark fractions and estimating.
  • 5.MD.B.2 Make a line plot of measurements in halves, quarters and eighths, and solve problems from it with fraction operations, like sharing a total equally.

© Copyright 2010. National Governors Association Center for Best Practices and Council of Chief State School Officers. All rights reserved.

5th Grade Data and Probability Test

5th Grade

The unit test for line plots in eighths and the data and chance lessons many states add, in two forms. Students make and use line plots, find the mean, median, mode and range, read and make tables and graphs of many kinds, and write probabilities and count outcomes.

Download PDF
Pin

What’s Included

  • The unit test in two forms, A and B (14 questions each)
  • Answer keys that name each question's lesson and skill (8 pages in all)
Can’t find what you need?

Tell us what to make next, or build your own with a worksheet maker.

Suggest a worksheet

Free to print and share

This worksheet is free to download, print, copy, and hand out in your classroom or at home. You do not need to create an account, and there are no watermarks on the PDF.