Loading preview...

Features

  • Find the mode of tally charts and pictographs and how many votes it has
  • Find the mode of bar graphs and line plots, including two modes and no mode
  • Choose the sentence that tells what a mode means
  • Find the mode of lists and tables, and write lists with a given mode
  • Level towers of cubes to see the mean as a fair share, then share things fairly
  • Find the mean by adding and dividing, and tell the mean from the mode
  • Every page in color and in black and white
  • Answer keys included

Skills Covered

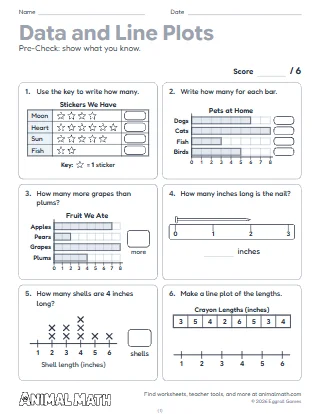
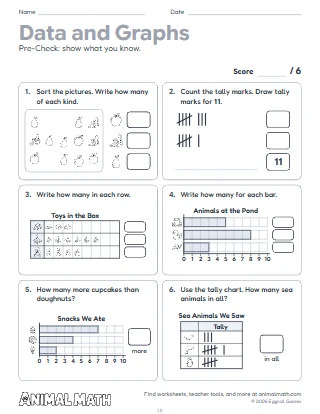
  • Find the mode of a tally chart, pictograph, bar graph or line plot
  • Find the mode of a list or a table, including two modes or no mode
  • Explain what the mode tells about the data
  • See the mean as a fair share by leveling towers of cubes
  • Find the mean by adding the numbers and dividing by how many there are
  • Tell the mean from the mode, and explain what each one shows

How to Use This Pack

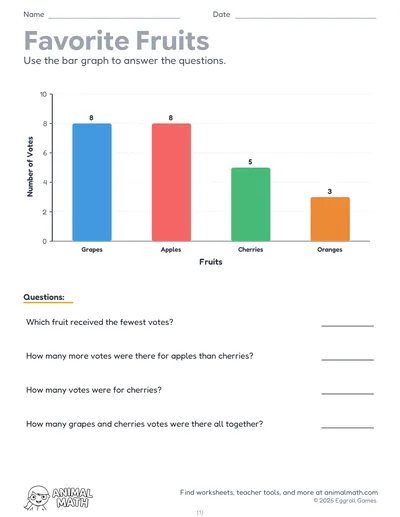
Five pages on the mode and the mean. Page 1 explains that the mode is the answer that shows up most often, then finds the mode of two tally charts and two pictographs and how many votes it has. Page 2 finds the mode of two bar graphs and two line plots, one with two modes and one with no mode, then asks students to circle the sentence that tells what a mode means. Page 3 finds the mode of four lists and two tables, where the mode is the value and not its count, then asks students to write lists of 5 numbers with a mode of 4, with two modes and with no mode. Page 4 shows the mean as a fair share: students draw towers of cubes all the same height, then share stickers, marbles, crackers and buttons fairly. Page 5 finds the mean of six small sets by adding and dividing, then finds the mean and the mode of two data sets and decides which one a sentence is about.

In the Classroom

Take a quick class vote, such as a favorite fruit, and record it as a tally chart. Ask which answer got the most votes and name it the mode. Then ask what it would mean if two answers tied. For the mean, give groups towers of linking cubes of different heights and let them move cubes until every tower is the same height; count the cubes in one tower. Then add all the cubes and divide by the number of towers, and compare.

At Home

Count something together over a week, such as books read or minutes outside each day, and write the numbers in a list. Which number shows up most often? Then share snacks or coins fairly between family members and talk about how many each person gets, and how adding and dividing gives the same answer.

Tips for Success

  • The mode is the answer or number that shows up most often
  • A set of data can have one mode, two modes or no mode
  • In a table, the mode is the value with the biggest count, not the count itself
  • The mean is a fair share: what each one gets when everything is shared equally
  • To find the mean, add the numbers, then divide by how many numbers there are

Common Core Standards Alignment

This pack supports the following Common Core State Standards for Mathematics:

  • 2.MD.D.9 Measure several objects, or one object several times, in whole units and display the results on a line plot.
  • 2.MD.D.10 Make picture and bar graphs (one unit per square or picture) for up to four categories, and answer joining, separating and comparing questions from them.
  • 3.MD.B.4 Measure lengths to the nearest half or quarter inch and show the measurements on a line plot marked in wholes, halves or quarters.

© Copyright 2010. National Governors Association Center for Best Practices and Council of Chief State School Officers. All rights reserved.

Finding the Mode and Mean

2nd – 3rd Grade

The mode of data in graphs, line plots, tables and lists, and the mean as a fair share. Students find the mode, including data with two modes or none, say what it tells, level towers of cubes, and find the mean by adding and dividing.

Download PDF
Pin

What’s Included

  • 5 worksheets in color and in black and white, with answer keys (15 pages)
  • The mode of tally charts, pictographs, bar graphs, line plots, lists and tables
  • What the mode tells, and lists made to fit a mode
  • The mean as a fair share, and the mean found by adding and dividing
Can’t find what you need?

Tell us what to make next, or build your own with a worksheet maker.

Suggest a worksheet

Free to print and share

This worksheet is free to download, print, copy, and hand out in your classroom or at home. You do not need to create an account, and there are no watermarks on the PDF.