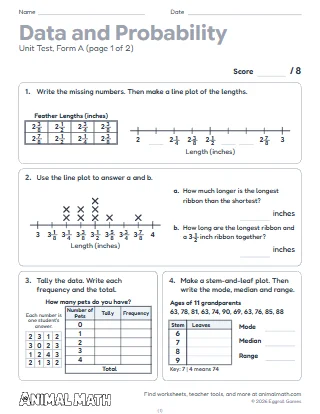
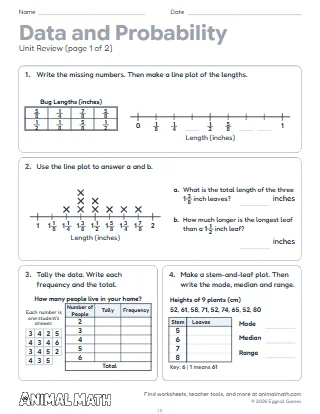
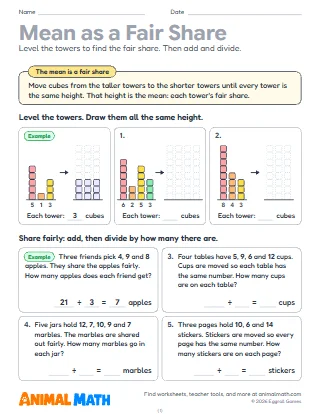
Five pages that follow data from the question to the answer. Page 1 has students circle the question that needs data in each pair, check whether a survey, an observation, a measurement or an experiment would collect the data for seven questions, and write a question of their own. Page 2 counts the letters in 24 first names and tallies them into a frequency table, with its title and the first column's label to write, then makes a whole table from the goals a team scored in 16 games; one- and two-step questions follow each table. Page 3 tallies earthworm lengths in quarter inches and reads a table of running times in tenths of a second, with questions such as how much longer the longest earthworm is than the shortest. Page 4 makes stem-and-leaf plots with the leaves in order, a title and a key, after a worked example, then rewrites a plot whose leaves were written down out of order. Page 5 reads a stem-and-leaf plot of points scored (least, greatest, range, mode, median and two more questions), then finds the mode, median and range from two frequency tables, one with fractions.
Start with page 1 as a class: read each pair of questions aloud and ask whether everyone would give the same answer. Then have each table group count the letters in their own first names and add them to a class frequency table on the board before page 2. For page 4, write a few two-digit numbers on sticky notes and sort them into rows by their tens digit to show where the stems come from.
Count something together for a week, such as the minutes spent reading each day or the cars that pass during dinner, and keep a tally. At the end, ask your child to make a frequency table and tell you the most common value and the range.
This pack supports the following Common Core State Standards for Mathematics:
© Copyright 2010. National Governors Association Center for Best Practices and Council of Chief State School Officers. All rights reserved.
Collecting data and showing it in frequency tables and stem-and-leaf plots, from the question to the mode, median and range. Students plan how to collect data, tally whole numbers, fractions and decimals into titled tables, make and read stem-and-leaf plots, and answer one- and two-step questions.
Tell us what to make next, or build your own with a worksheet maker.
This worksheet is free to download, print, copy, and hand out in your classroom or at home. You do not need to create an account, and there are no watermarks on the PDF.