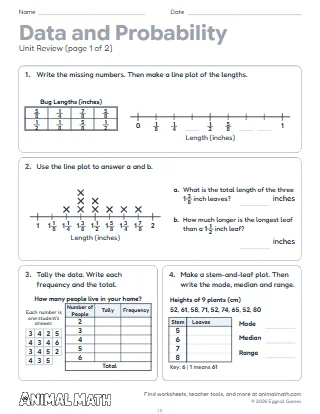
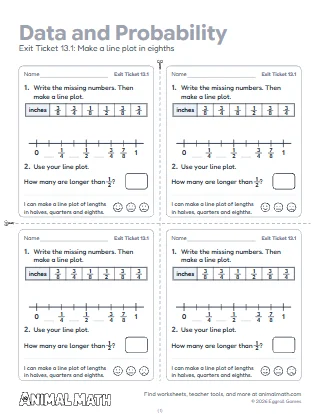
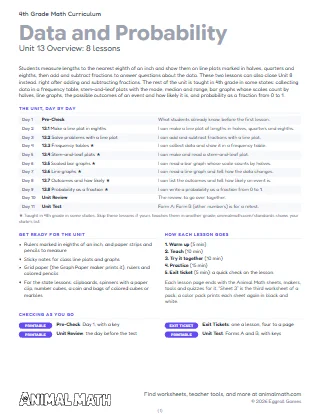
The unit test for the 4th grade unit on data, line plots and probability. Pages 1 and 2 are Form A. Pages 3 and 4 are Form B: the same questions in the same order with different data, for a retake, a make-up or a second seating. Each form has 8 questions and a Score line on its first page. Questions 1 and 2 are the Common Core line plot lessons; questions 3 to 8 (a frequency table, a stem-and-leaf plot, a bar graph that counts by halves, a line graph, how likely an event is, and probability as a fraction) are for the states that teach them in 4th grade. The pre-check and the unit review are packs of their own.
Give Form A the day after the unit review. A class that follows the Common Core can stop after question 2 and score out of 2. In other states, give the questions your state teaches: frequency tables (Florida, Georgia, Indiana, Oklahoma, South Carolina, Texas and Virginia), stem-and-leaf plots with the mode, median and range (Florida and Texas), bar graphs with a fraction scale (Georgia, Indiana, Oklahoma and South Carolina), line graphs (Virginia), how likely an event is (South Carolina and Virginia) and probability as a fraction (Virginia). Questions 2, 5 and 6 have two parts and questions 7 and 8 three: give the point when every part is right, or a share of the point for each part. The answer keys name each question's skill, so a missed question points to the lesson to reteach.
Use Form B as a check after the unit. Measure a few pencils or leaves to the nearest eighth inch together and make a line plot of the lengths, then ask how much longer the longest is than the shortest.
This pack supports the following Common Core State Standards for Mathematics:
© Copyright 2010. National Governors Association Center for Best Practices and Council of Chief State School Officers. All rights reserved.
The unit test for line plots in eighths and the data and chance lessons many states add, in two forms. Students make and use line plots, tally a frequency table, make a stem-and-leaf plot, read bar and line graphs, and say how likely an event is, in words and as a fraction.
Tell us what to make next, or build your own with a worksheet maker.
This worksheet is free to download, print, copy, and hand out in your classroom or at home. You do not need to create an account, and there are no watermarks on the PDF.