Loading preview...

Features

  • The goal and its "I can" line, what to get ready and the words to use
  • A 45 minute lesson in five steps (warm up, teach with words to say, try it together, practice, exit ticket)
  • Questions to ask, and the mistakes students make and what to do about them
  • Ideas for students who need help or are ready for more
  • Each plan ends with the Animal Math worksheets, worksheet makers, tool and quizzes for that lesson
  • Lessons: line plots in eighths, adding and subtracting with a line plot, frequency tables, stem-and-leaf plots, scaled bar graphs, line graphs, outcomes and how likely, and probability as a fraction
  • Lessons 13.3 to 13.8 are for the states that teach them in 4th grade

4th Grade Math CurriculumUnit 13

These are the lesson plans for Unit 13 of 15 in the 4th Grade Math Curriculum: 127 lessons in teaching order, week by week, each with a lesson plan and an exit ticket.

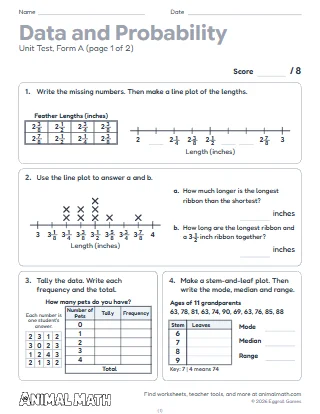
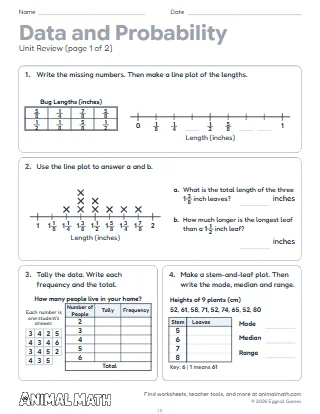
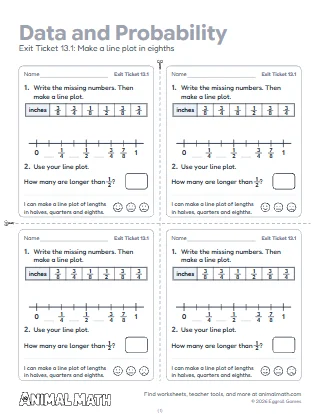
Also for this unit: exit tickets, pre-check, unit review and test. See the whole year

Resources for Each Lesson

Everything each lesson plan points to, with links. Sheet numbers count worksheets: a color pack prints each sheet again in black and white.

13.1 Make a line plot in eighths

13.2 Solve problems with a line plot

13.3 Frequency tables ★

13.4 Stem-and-leaf plots ★

13.5 Scaled bar graphs ★

13.6 Line graphs ★

13.7 Outcomes and how likely ★

13.8 Probability as a fraction ★

★ Taught in 4th grade in some states.

Skills Covered

  • Make a line plot of lengths in halves, quarters and eighths
  • Add and subtract fractions with a line plot
  • Collect data in a frequency table
  • Make a stem-and-leaf plot; find the mode, median and range
  • Read bar graphs whose scales count by halves
  • Read and draw line graphs
  • List outcomes and say how likely an event is
  • Write a probability as a fraction from 0 to 1

How to Use This Pack

Eight lesson plans, one for each lesson of a 4th grade unit on data and probability, in teaching order, after an overview page that lays the unit out day by day: a pre-check, the eight lessons, a review and the unit test. Each plan fits on one page. It gives the goal, what to get ready, the words to use, the lesson in five steps with the words to say, questions to ask, common mistakes and what to do about them, and the Animal Math worksheets, makers, tool and quizzes for the lesson.

In the Classroom

Print the unit, or just the day's page, and teach from it. Each lesson takes about 45 minutes: a 5 minute warm up, 10 minutes of teaching, 10 minutes together, 15 minutes of practice and an exit ticket at the end. The two line plot lessons can also close the unit on adding and subtracting fractions. Lessons 13.3 to 13.8 (frequency tables, stem-and-leaf plots, scaled bar graphs, line graphs and probability) are taught in 4th grade in some states; skip the ones yours teaches in another grade. The exit tickets and the unit test are separate packs, made for these lessons, and the plans use other data than they do.

At Home

Teaching at home? Use the warm up and the "Try it together" step as a short lesson, and the "Words to use" as the way to talk about it. A ruler marked in eighths, a family survey and a homemade paper clip spinner work as well as classroom ones. The mistakes to watch for are the ones most children make.

Tips for Success

  • Read the "Watch for" box before the lesson: it is what to listen for while students work
  • Write halves and quarters as eighths before plotting or adding them
  • Ask "What is each line worth?" before reading any graph
  • Sort the exit tickets into got it, almost and not yet to plan the next day
  • Use the help and challenge ideas for small groups during practice

Common Core Standards Alignment

This pack supports the following Common Core State Standards for Mathematics:

  • 3.MD.B.3 Make picture and bar graphs where each symbol or square stands for several items, and answer one- and two-step comparison questions from them.
  • 4.NF.B.3a Understand adding and subtracting fractions as joining and taking away parts of the same whole.
  • 4.NF.B.3c Add and subtract mixed numbers with the same denominator, for example by changing them to fractions or by using properties of operations.
  • 4.NF.B.3d Solve story problems that add or subtract fractions of the same whole with like denominators, using fraction models and equations.
  • 4.MD.B.4 Make a line plot of measurements in halves, quarters and eighths, and use it to solve problems that add and subtract fractions.

© Copyright 2010. National Governors Association Center for Best Practices and Council of Chief State School Officers. All rights reserved.

4th Grade Data and Probability Lesson Plans

Lesson plans for every lesson of a unit on line plots in eighths, data and probability, from measuring to the eighth inch to writing a probability as a fraction. Each one-page plan gives a lesson in five steps, common mistakes and the worksheets to use, after a unit overview.

Download PDF
Pin

What’s Included

  • 8 one-page lesson plans, one for each lesson of the unit
  • A unit overview: the unit day by day, what to get ready, how each lesson goes
  • Words to say, questions to ask and common mistakes for every lesson
  • The worksheets, makers, tool and quizzes for each lesson (9 pages in all)
Can’t find what you need?

Tell us what to make next, or build your own with a worksheet maker.

Suggest a worksheet

Free to print and share

This worksheet is free to download, print, copy, and hand out in your classroom or at home. You do not need to create an account, and there are no watermarks on the PDF.