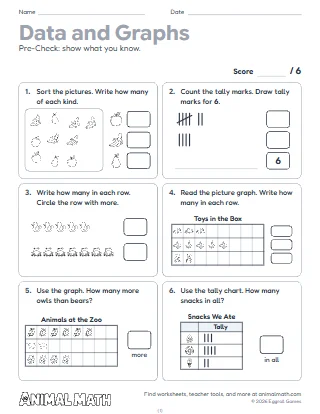
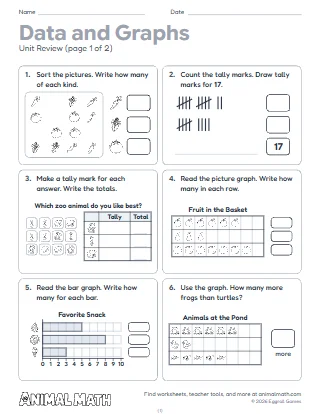
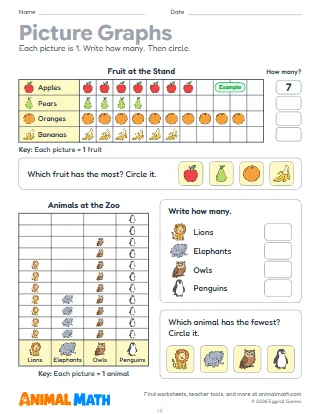
Seven pages for a survey the children plan themselves. Page 1 is a finished example to show first: a class walk, the treasures found (pebbles, acorns, leaves and pinecones), their tally chart, their picture graph and what the class found out. Page 2, Our Question, has lines for the question and a tally chart with four choices, each with a box to draw it, a line for its name, a space for tally marks and a box for the total. Pages 3 and 4 are picture graphs for 3 and for 4 choices, with a title line, ten squares a column to draw in and a box and a line under each column for the choice. Pages 5 and 6 are bar graphs with four columns, numbered to 10 and to 20. Page 7, What We Found Out, has the most and the fewest (draw the choice, write how many), how many in all (add the totals, or count them all into the last box), something we noticed and a new question.
Start with the children's own wonderings: "Which fruit do we like best?", "How do we get to school?", "Which treasure will we find most on our walk?" Show the example and talk about what the class did first, next and last. Choose a question together and keep it to two, three or four choices so the graph stays clear. Children draw each choice, ask their classmates and make a tally mark for each answer, then build the graph that fits: the picture graph for younger children, the bar graph to 20 for a bigger class. End with What We Found Out, and keep the new question for the next survey. Display the finished pages as documentation of the project.
Ask a family question at dinner ("Which is the best day of the week?") or count something on a walk (dogs, red cars, birds). Help your child draw the choices, make tally marks and turn them into a picture graph. Then ask: which has the most? The fewest? How many in all? What would you like to find out next?
This pack supports the following Common Core State Standards for Mathematics:
© Copyright 2010. National Governors Association Center for Best Practices and Council of Chief State School Officers. All rights reserved.
Reggio-inspired templates for a survey of the class's own: their question, their choices, their tallies and their graph. Children write the question, draw the choices, tally the answers, build a picture graph or a bar graph and say what they found out, with a finished loose-parts example to show first.
Tell us what to make next, or build your own with a worksheet maker.
This worksheet is free to download, print, copy, and hand out in your classroom or at home. You do not need to create an account, and there are no watermarks on the PDF.