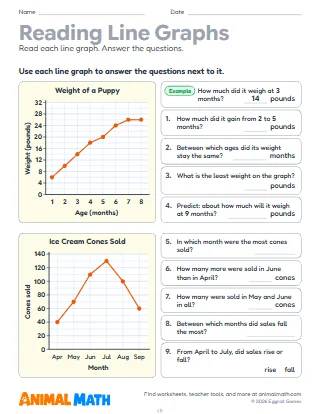
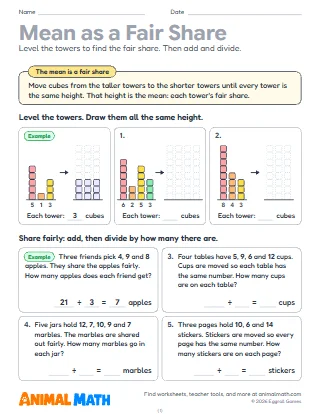
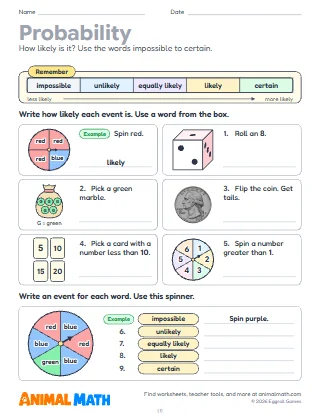
Five pages on the data displays some states add in 5th grade. Page 1 reads two scatterplots whose points are lettered: point D on the sunlight graph means a plant that got 4 hours of sun a day and is 16 cm tall; students find the tallest plant and the oldest bike, count points above or below a value, work out how much more or how much in all, and say whether the data tends to go up or go down. Page 2 makes scatterplots from tables: a finished example, then a blank graph where students write the title, the axis labels and both scales before they plot the pairs. Page 3 reads histograms, where each bar is an equal interval such as 20 to 29 minutes and the bars touch, then sorts data sets into bar graphs and histograms. Page 4 tallies raw data into equal intervals in a frequency table and draws the bars. Page 5 reads three circle graphs cut into eighths, sixths and tenths (half of 32 students ride the bus, so 16 do), then chooses the best of six displays for six sets of data. Every page starts with a worked example.
Collect two numbers from each student (hand span and height, or hours of sleep and minutes of reading) and plot the pairs on a big scatterplot on the board. Ask what one dot means, then whether the dots tend to go up. Then group everyone's height into intervals of 5 cm and build a histogram with sticky notes, bars touching. Compare it with a bar graph of favorite colors: why do those bars have gaps?
Look for graphs in the news, on cereal boxes or in sports pages, and name each one: is it a circle graph, a bar graph, a histogram? Make a circle graph of how the day is spent (sleep, school, play) by cutting a paper plate into equal parts.
This pack supports the following Common Core State Standards for Mathematics:
© Copyright 2010. National Governors Association Center for Best Practices and Council of Chief State School Officers. All rights reserved.
Three more ways to show data: scatterplots of paired data, histograms of numbers in equal intervals, and circle graphs that split a whole into parts. Students read and make scatterplots and histograms, read circle graphs as fractions of a whole, and choose the best display for a set of data.
Tell us what to make next, or build your own with a worksheet maker.
This worksheet is free to download, print, copy, and hand out in your classroom or at home. You do not need to create an account, and there are no watermarks on the PDF.