The pull of the Moon (and a little of the Sun) makes the sea rise and fall. On most coasts there are two high tides and two low tides a day, about 6 hours 12 minutes apart, and each day the tides come about 50 minutes later than the day before, as the Moon rises later. Tide times are printed in tide tables and given with the weather forecast. Checking them before a beach walk matters: the water can come in quickly and cut off a rock shelf, a headland or a sandbar.
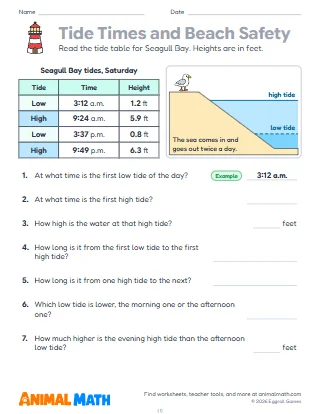
Six pages. Page 1 is a day's tide table for one beach, with the time and height of each tide in metres: find the tides, how long from low to high and from high to high, and the difference in height. Page 2 goes from low tide to high tide in two steps, adding 6 hours and then 12 minutes, and then follows a week of morning high tides, each 50 minutes later, on a time line. Page 3 is a tide graph of one day to read hour by hour, with a dashed line where the path out to the rocks goes under water. Page 4 uses the rule of twelfths, in centimetres: find one twelfth of the range, the rise each hour and the height after each hour. Page 5 plans a safe day at the beach with the tide times: when the rock pools are safe, whether a walk round the headland is back in time, how long there is to swim between the flags and when to be back across a sandbar. Page 6 is six word problems. The first problem on pages 1 to 5 is worked as an example.
Look up tomorrow's tide times for a beach near you (the weather forecast or a tide website gives them) and work out the time from low to high together, as on page 2. Before page 4, show the rule of twelfths with 12 cubes: stack 1, then 2, 3, 3, 2 and 1 more, one stack an hour. On page 5, talk about why the times matter: what happens if the walk takes longer than planned?
Before a trip to the beach, look up the tide times together and decide when the rock pools will be best. At the beach, watch where the water reaches and look again an hour later.
This pack supports the following Common Core State Standards for Mathematics:
© Copyright 2010. National Governors Association Center for Best Practices and Council of Chief State School Officers. All rights reserved.
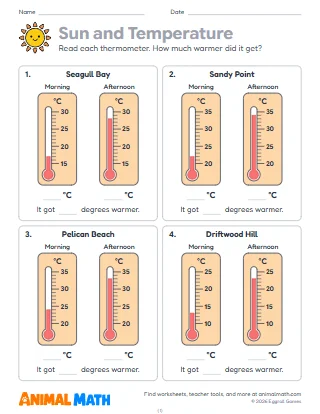
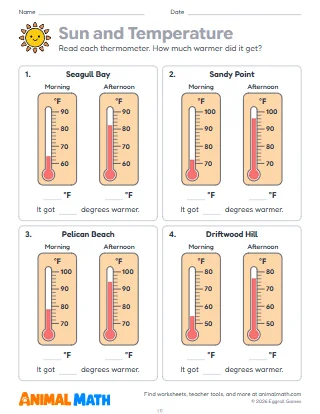
Tide tables, tide graphs and a day at the beach planned around the tides, with heights in metres and centimetres and elapsed time all the way through. Students read when the high and low tides come and how high they are, add 6 hours 12 minutes from low to high, follow a week of tides, use the rule of twelfths and work out when the rock pools, the headland walk and the sandbar are safe.
Tell us what to make next, or build your own with a worksheet maker.
This worksheet is free to download, print, copy, and hand out in your classroom or at home. You do not need to create an account, and there are no watermarks on the PDF.