Veterans Day, on November 11, honors everyone who has served in the United States armed forces. Many towns hold a parade with flags, bands and veterans wearing their medals, and many classes send thank-you cards. These graphs are about those things, so they suit a classroom celebration.
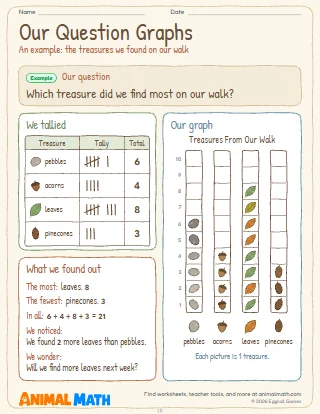
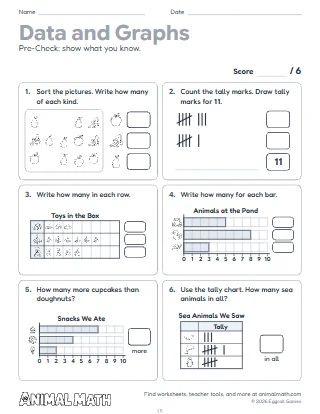
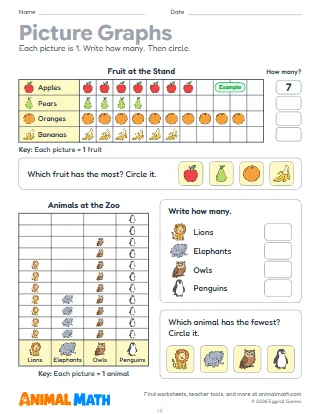
Five pages of graphs about a Veterans Day parade. Page 1 is a pictograph of what a class saw at the parade, where each badge stands for 2 and half a badge for 1: a worked example counts the drums by 2s, then students write how many of each and answer which they saw the most and the fewest of, how many more, and how many in all. Page 2 has two pictographs side by side, thank-you cards with a key of 5 and flags handed out with a key of 10, each with an example, a how many more or fewer question and a two-step question. On page 3 students count the tally marks of a class vote and draw the pictograph themselves, a whole badge for every 2 votes and a half badge for 1; the first row is drawn as an example. Page 4 is a bar graph that goes across and counts by 5, of cards mailed to veterans each week, with six questions. On page 5 students draw the bars of a graph that counts by 2 from a tally chart of the parade band, where an odd number ends halfway between two lines, then answer three questions.
Before page 1, draw a few badges on the board and say each one stands for 2: ask how many 3 badges show, then what half a badge would be. Remind students to read the key before they count. Page 3 and page 5 can be done in pairs, one reading the tally marks aloud and one drawing. Pair page 4 with mailing real thank-you cards to a veterans home.
Count something together, such as flags on your street or cars that go by, and make a graph where each picture stands for 2. Ask questions about it: which has the most, how many more, how many in all. Talk about someone in your family or neighborhood who has served, and make a card for them.
This pack supports the following Common Core State Standards for Mathematics:
© Copyright 2010. National Governors Association Center for Best Practices and Council of Chief State School Officers. All rights reserved.
Picture graphs and bar graphs about a Veterans Day parade, where one picture or one line stands for 2, 5 or 10. Students read the graphs, make their own from tally charts and answer how many more, how many fewer and how many in all.
Tell us what to make next, or build your own with a worksheet maker.
This worksheet is free to download, print, copy, and hand out in your classroom or at home. You do not need to create an account, and there are no watermarks on the PDF.