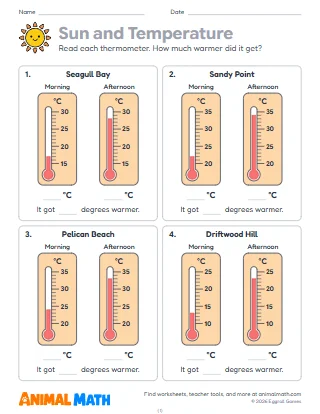
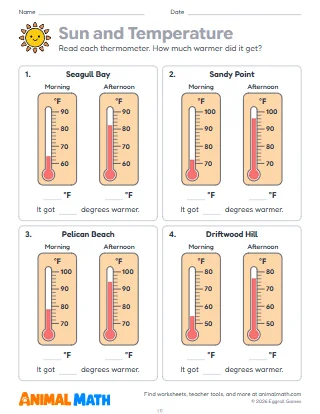
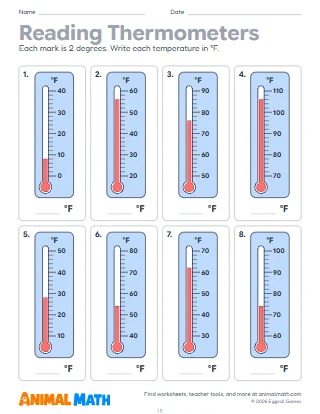
Six pages that build from 3rd to 5th grade. Page 1 shows a morning and an afternoon thermometer for four towns, in °F with a mark every 2 degrees: write both temperatures and how much warmer it got. Page 2 gives a week of high temperatures in a table: plot them as a line graph, then find the warmest and coldest days, the days below freezing and the biggest drop. Page 3 is a line graph of one winter day, hour by hour, to read and answer questions about. Pages 4 to 6 go below zero in °C: read eight thermometers, put six towns' morning temperatures in order and find the differences across zero, then read pairs of thermometers and solve three word problems.
Keep a class weather chart for a week in January and graph it the way page 2 does. For the pages below zero, draw a big thermometer on the board and count the marks down past 0 together: one below is −1, two below is −2. Pages 1 to 3 suit 3rd and 4th grade; pages 4 to 6 are for 5th grade (Year 6 in England).
Check the temperature each morning for a week and write it down, then compare the warmest and the coldest day. If it drops below freezing, look for ice on puddles and talk about why water freezes at 32°F (0°C).
This pack supports the following Common Core State Standards for Mathematics:
© Copyright 2010. National Governors Association Center for Best Practices and Council of Chief State School Officers. All rights reserved.
Winter temperatures on thermometers, tables and line graphs, in Fahrenheit and in Celsius, from a cold afternoon to mornings below zero. Students read thermometers, graph a week of highs, read a day hour by hour, order temperatures below and above zero and find how many degrees warmer or colder it got.
Tell us what to make next, or build your own with a worksheet maker.
This worksheet is free to download, print, copy, and hand out in your classroom or at home. You do not need to create an account, and there are no watermarks on the PDF.