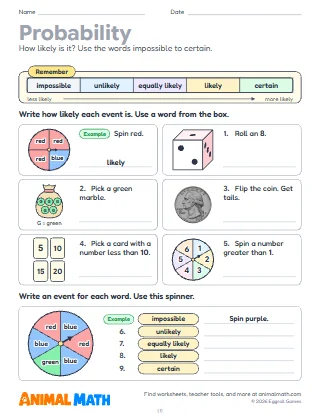
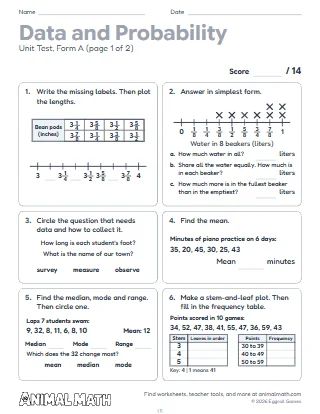
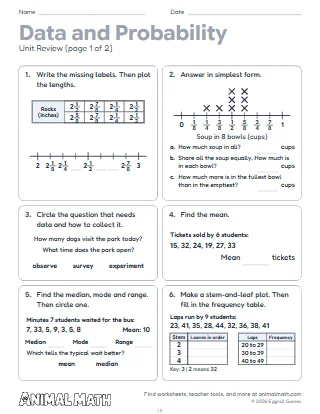
Five pages for Years 5 and 6 on repeating chance experiments and using the results. Page 1 works out what to expect from coins, dice and spinners, some with equal parts and some without. Page 2 gives two finished tally records: children count the tallies, write each result as a fraction, a decimal and a percentage, and compare them with what was expected. Page 3 follows one experiment after 10, 50, 100 and 500 trials, so children can see the results settle towards what was expected. Page 4 matches four result tables to the spinners and the special die that made them, and page 5 uses relative frequency to estimate chances and predict the next results.
Ask everyone to flip a coin 10 times and record the heads. Few will get exactly 5. Then put the whole class's results together on the board and work out the fraction of heads: it is usually much closer to one half. Talk about why more trials give a better estimate, then try page 3.
Flip a coin or roll a die together 20 times and keep a tally. Was it what you expected? Then do 20 more and add them on. Try making a spinner from a paper plate with one big part and two small ones, and guess the results before you spin.
This pack supports the following Common Core State Standards for Mathematics:
© Copyright 2010. National Governors Association Center for Best Practices and Council of Chief State School Officers. All rights reserved.
Repeated chance experiments with coins, dice and spinners, fair and unfair, and what their results say about the chances. Students work out expected results, turn tally records into relative frequencies, watch results settle as the trials grow, match results to the spinner or die that made them and predict from results.
Tell us what to make next, or build your own with a worksheet maker.
This worksheet is free to download, print, copy, and hand out in your classroom or at home. You do not need to create an account, and there are no watermarks on the PDF.