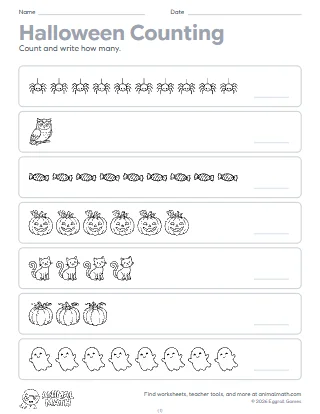
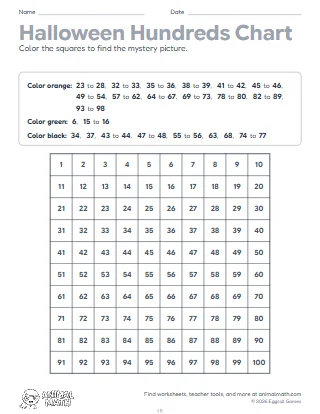
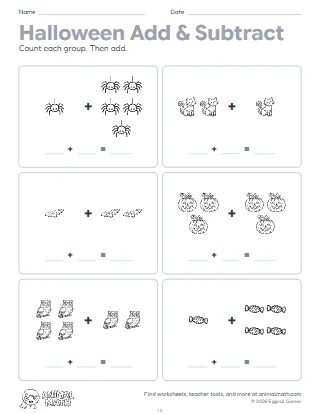
Four Halloween graphing pages. Each one starts with a Halloween-night picture to count. On pages 1 and 2, students color one box on the graph for each picture of three kinds, then answer four questions. Pages 3 and 4 have four kinds of pictures and add a tally chart before the graph.
Model page 1 together: count the ghosts, cross each one off, and color that many boxes. Then let students try page 2 on their own or with a partner. Pages 3 and 4 work well in a math center the week of Halloween.
Have your child cross off each picture as they count it so none are counted twice. Ask them to explain the graph out loud: which column is tallest, and what does that tell you?
This pack supports the following Common Core State Standards for Mathematics:
© Copyright 2010. National Governors Association Center for Best Practices and Council of Chief State School Officers. All rights reserved.
Halloween graphing with ghosts, bats, cats, spiders and jack-o'-lanterns to count. Students color one box for each picture on a bar graph, make tally marks and answer most, fewest, how many more and how many in all.
Tell us what to make next, or build your own with a worksheet maker.
This worksheet is free to download, print, copy, and hand out in your classroom or at home. You do not need to create an account, and there are no watermarks on the PDF.