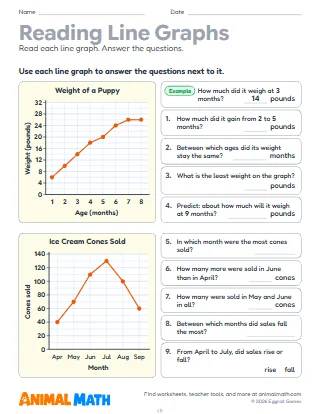
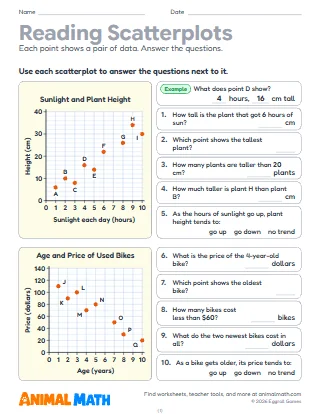
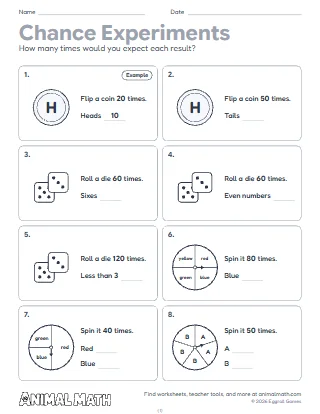
Five pages for Year 6 on questioning the graphs, surveys and headlines found in print and online. Page 1 shows column graphs whose value axis starts above zero: children read the real values, then work out how many times taller one column looks and how many times bigger its value really is. Page 2 has uneven scales and pictographs where the bigger number gets a bigger picture: children name what is wrong and compare what the graph shows with the real values. Page 3 gives six survey claims to judge as fair or not, with a reason chosen from a short list. Page 4 asks children to redraw three misleading graphs on a fair axis that starts at zero, and page 5 checks newspaper headlines against a table and a graph: true, false or can't tell.
Draw two columns on the board for 50 and 60, with the value axis starting at 45. Ask how many times taller the second column looks, then how much bigger 60 really is than 50. Talk about why someone might draw a graph like that. Page 3 makes a good discussion: would the answer change if the same question were asked at a different place?
Look for graphs and survey results in newspapers, on websites or in advertisements. Check together where the value axis starts, whether the steps are equal and who was asked. Would the graph look different if it were drawn fairly?
This pack supports the following Common Core State Standards for Mathematics:
© Copyright 2010. National Governors Association Center for Best Practices and Council of Chief State School Officers. All rights reserved.
Spotting graphs, surveys and headlines that make data look different from what it really is. Students read graphs whose scales do not start at zero or go up unevenly, compare how big things look with how big they really are, judge surveys, redraw graphs fairly and test headlines against the data.
Tell us what to make next, or build your own with a worksheet maker.
This worksheet is free to download, print, copy, and hand out in your classroom or at home. You do not need to create an account, and there are no watermarks on the PDF.