Many people start a new year by picking a goal: to read more, learn to swim, ride a bike or eat more fruit. Graphing a class's goals is a friendly way to start the year, and keeping track of a goal, such as the minutes read each day, turns into data to plot. The classes, votes and minutes on these pages are made up.
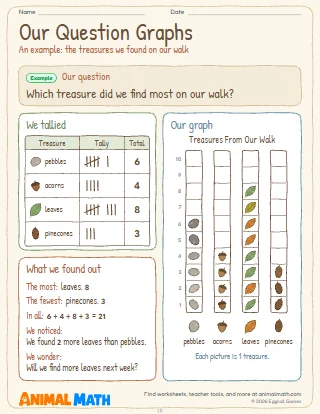
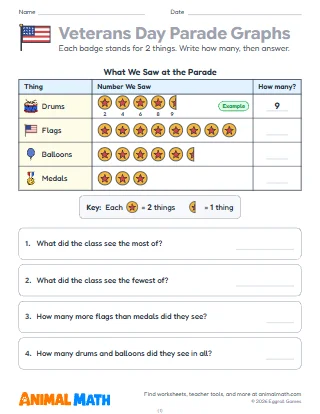
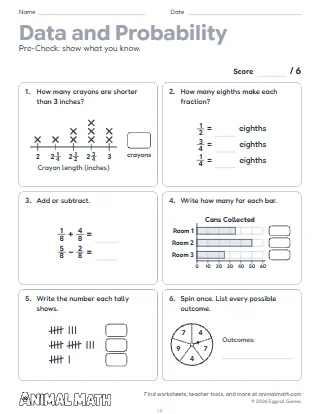
Six pages of graphs about goals for the new year. Page 1 is a tally chart of one class's goals: children write each total (the first is done) and answer five questions. Page 2 is a picture graph where each star stands for 2 votes and half a star for 1. Page 3 gives a table: children draw a bar for each goal on a graph that counts by 2s, with the first bar drawn. Page 4 reads a bar graph that goes across, counting by 5s, of books read in January. Page 5 turns a list of the minutes read each day into a line plot. Page 6 is a line plot with fractions: practice times in quarter hours, then adding and subtracting the times.
Start by asking the class for their own goals and keeping a tally on the board, then compare it with page 1. Pages 1 and 2 suit 2nd grade, pages 3 and 4 3rd grade, page 5 2nd and 3rd grade, and page 6 is 4th grade work. On pages 5 and 6, cross off each number on the list as you plot it.
Pick a goal together for the new year, such as reading every day, and keep a tally or a list of the minutes on the fridge. At the end of the month, make a line plot of it and talk about what it shows.
Graphs of a class's New Year goals and a reading goal: tally charts, picture graphs, bar graphs and line plots. Students count tallies, read a picture graph with a key of 2, draw and read bar graphs scaled by 2 and 5, make a line plot of minutes read and a line plot of practice times in quarter hours.
Tell us what to make next, or build your own with a worksheet maker.
This worksheet is free to download, print, copy, and hand out in your classroom or at home. You do not need to create an account, and there are no watermarks on the PDF.