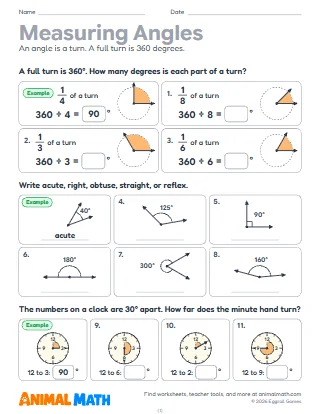
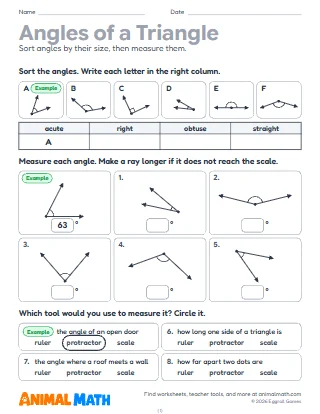
Six templates. Page 1 is a polar grid: 10 rings around a center point and a line every 15 degrees, with the degrees marked around the outside, 0 on the right and counting counterclockwise. Page 2 has a mark for every degree around the outside, a full-circle protractor for drawing and measuring angles, and page 3 has four small polar grids. Pages 4 to 6 are blank radar charts with 5, 6 and 8 spokes: write a category at each spoke, mark a rating on each, then join the marks to see the shape of the data.
On page 2, have students draw an angle of 40 degrees from the 0 line, then one of 130 degrees, and find the angle between them. Use a radar chart for a self-check at the end of a unit: each spoke is a skill, rated 1 to 5, so students see their strengths at a glance.
Make a radar chart of a favorite sport or game: rate a few players or characters on speed, strength and skill, then compare their shapes.
This pack supports the following Common Core State Standards for Mathematics:
© Copyright 2010. National Governors Association Center for Best Practices and Council of Chief State School Officers. All rights reserved.
Printable polar graph paper with degrees around the outside, a 360 degree protractor grid, and blank radar charts with 5, 6 and 8 spokes. Students draw and measure angles, plot points by angle and distance, and show data such as their own ratings on a radar chart.
Tell us what to make next, or build your own with a worksheet maker.
This worksheet is free to download, print, copy, and hand out in your classroom or at home. You do not need to create an account, and there are no watermarks on the PDF.